Powerful Renewable Energy Trends
Energy transition has been a growing topic of discussion among investors and policymakers, driven by technological innovations to improve the economics of renewable energy, the increasing role of environmental, social, and governance (ESG) investing, and a greater sense of urgency surrounding climate change.
According to the BP Statistical Review, in order to maintain the level of carbon emissions from the power sector at its 2015 level, the world needs to be adding renewable energy at a much faster rate. Since 2015, 800TWh of renewable power generation has been added, but an additional 1,000TWh is required, an amount equal to the entire renewable energy generation of the US and China combined.
In late 2019, the European Council decided to move forth with the European Green Deal, a policy calling for the European Union to generate net-zero carbon emissions by 2050, becoming the world’s first climate neutral bloc, behind an estimated €1 trillion in spending on renewable energy. Goldman Sachs expects that €7 trillion worth of total investment will be needed through 2050 to achieve these goals (Exhibit 1), calling the Green Deal the largest economic stimulus for the continent since the Marshall Plan.
Exhibit 1: Estimated Breakdown of Green Deal Spending
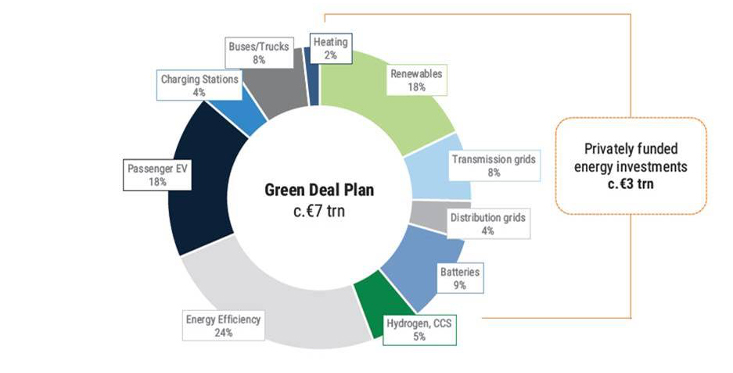
Source: Goldman Sachs Global Investment Research
In the US, presumptive Democratic presidential nominee Joe Biden outlined an ambitious climate plan encompassing $2 trillion worth of investment and including a carbon pollution-free power sector by 2035 as part of a path to net-zero carbon emissions by 2050.
China has made measured progress on carbon emissions reductions, with efforts likely to intensify in the years ahead. Coal-fired power currently comprises 59% of China’s power mix, down from 70% in recent years. The 2009 Copenhagen Accord called for a reduction of carbon intensity by 40-45% by 2020, as compared to 2005 levels, an objective which China has met. China now seeks peak emissions by 2030 as part of the Paris Climate Agreement.
India is the third-largest power consuming country in the world, behind China and the US. Installed capacity of power doubled in the last decade to meet growing demand, yet is still dominated by coal, given the country’s prolific domestic resource base. That said, wind and solar capacity increased four-fold over the last decade, reaching an installed base of 82MW. India hopes to double its renewables capacity by 2022 and further increase it to 450MW by 2030.
Companies are also joining the push for carbon neutrality, with the likes of Apple, Novo Nordisk, Mars, and L’Oreal pledging to cut emissions, while Microsoft plans to be carbon negative by 2030.
Renewable energy now accounts for 10% of the global electricity mix (up from 5% in 2012). When further including hydroelectric power, many of the world’s largest economies are generating material percentages of their power from renewables (Exhibit 2).
Exhibit 2: Renewable Share of Power Generation
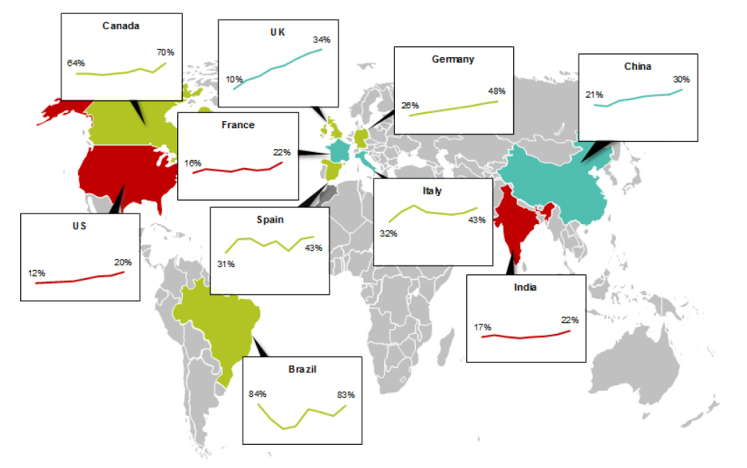
Source: Company reports, BNEF, Bernstein analysis and estimates
Solar
Solar energy has achieved retail parity in the US and Europe, and grid parity in sunny places like California. Solar’s levelized cost of energy (LCOE), defined as lifetime cost divided by lifetime energy output, is now highly competitive with fossil fuels (Exhibit 3). The same may hold true in China in the coming two to three years, which could represent a game-changer for new solar installations.
Exhibit 3: Solar Energy Costs are Competitive with Fossil Fuels
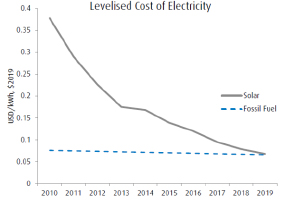
Source: IRENA, BMO capital markets
The two most important variables that improve the economics of solar power are cost per watt and efficiency. As shown below, advanced technologies for the production of solar cells, such as PERC (passivated emitter and rear contact) and HJT (heterojunction technology), are rapidly achieving cost reduction (Exhibit 4) and rising efficiency (Exhibit 5).
As of March 31, 2020, total announced HJT capacity installation plans in China stood at 32GW, substantially higher than the 1.8GW of currently installed capacity. In China’s efforts to achieve grid parity, this is a technology that holds promise.
Exhibit 4: Cost Per Watt Reduction in Key Solar Cell Production Technologies
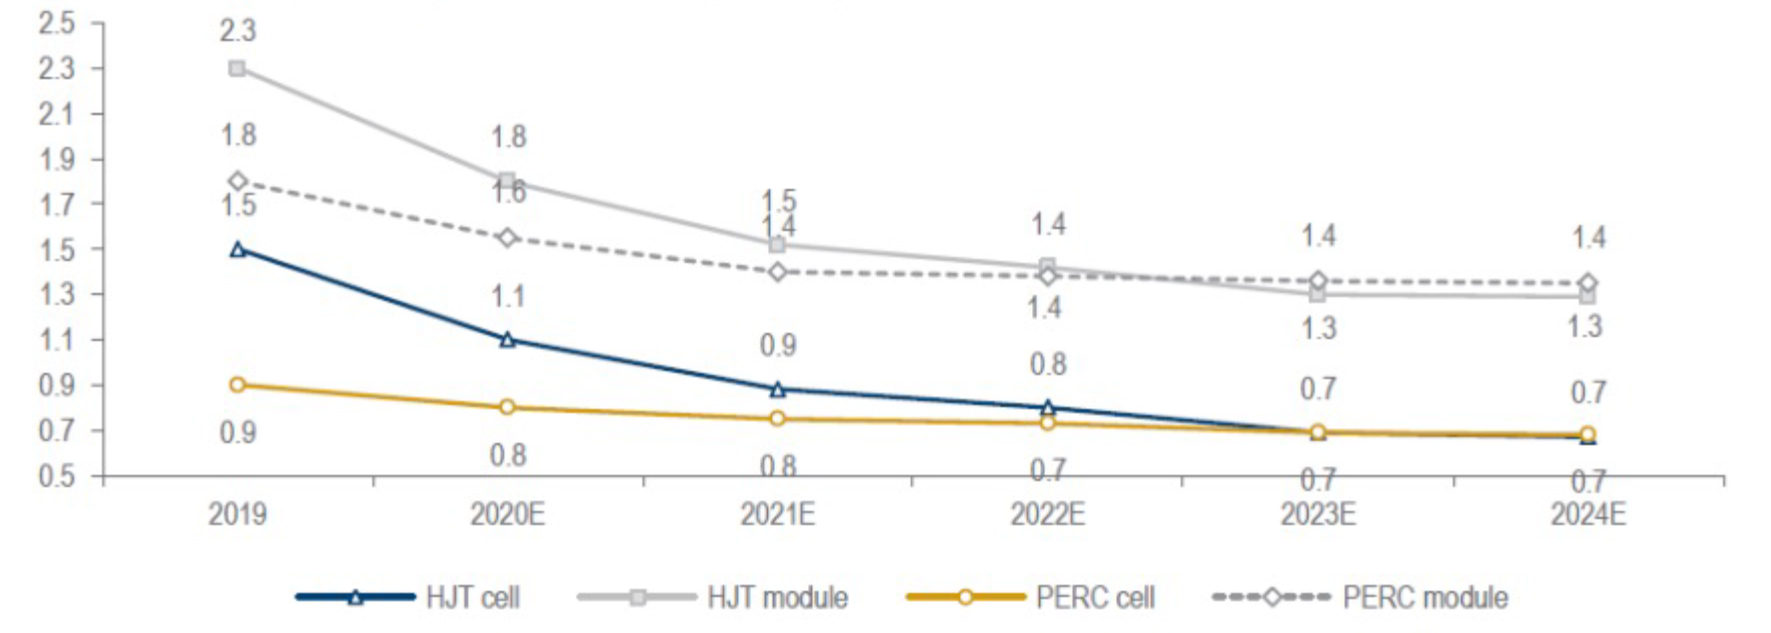
Source: 5th HJT conference, Daiwa forecasts
Exhibit 5: Efficiency Improvement in Key Solar Cell Production Technologies
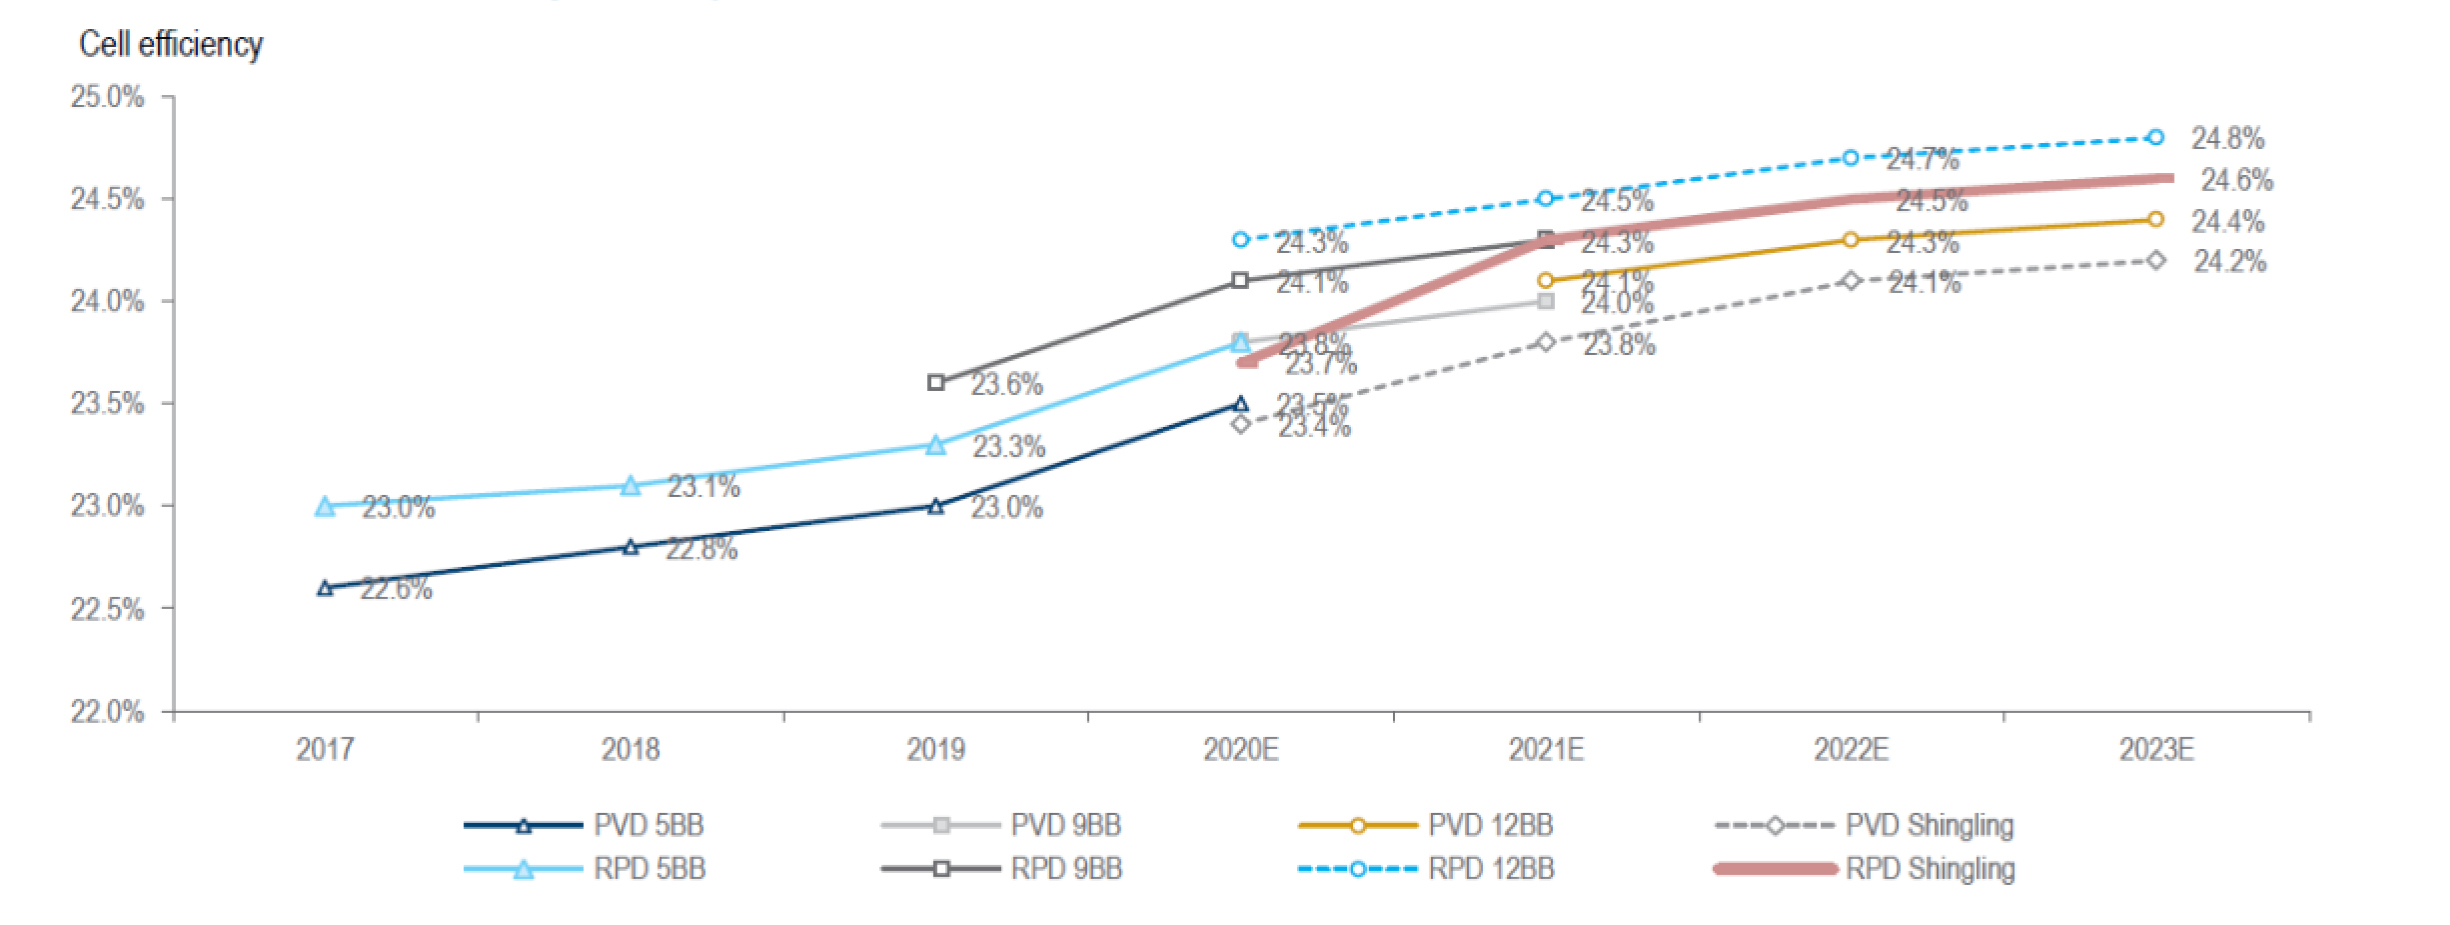
Source: 5th HJT conference, Akcome
Wind
Onshore wind power has been a viable technology for several decades, as the first wind farm was constructed in 1980. This relatively mature form of renewable energy continues to grow at a decent rate (Exhibit 6), but has become somewhat “stuck in the middle” between the lower cost solar and the more scalable offshore wind. That said, leading wind turbine players continue to improve their scale and performance, improving the growth visibility of onshore wind.
Chinese companies have undertaken meaningful technological advances in the production of wind turbines, as well as carbon fiber, the main raw material input. We like a position in China’s leading producer of carbon fiber, which benefits from a contract with the world’s largest wind turbine manufacturer. As the company continues to increase the quality of its carbon fiber, we expect improvements in pricing power and greater usage in advanced applications such as offshore wind will follow.
Exhibit 6: Onshore wind Capacity (Terawatts)
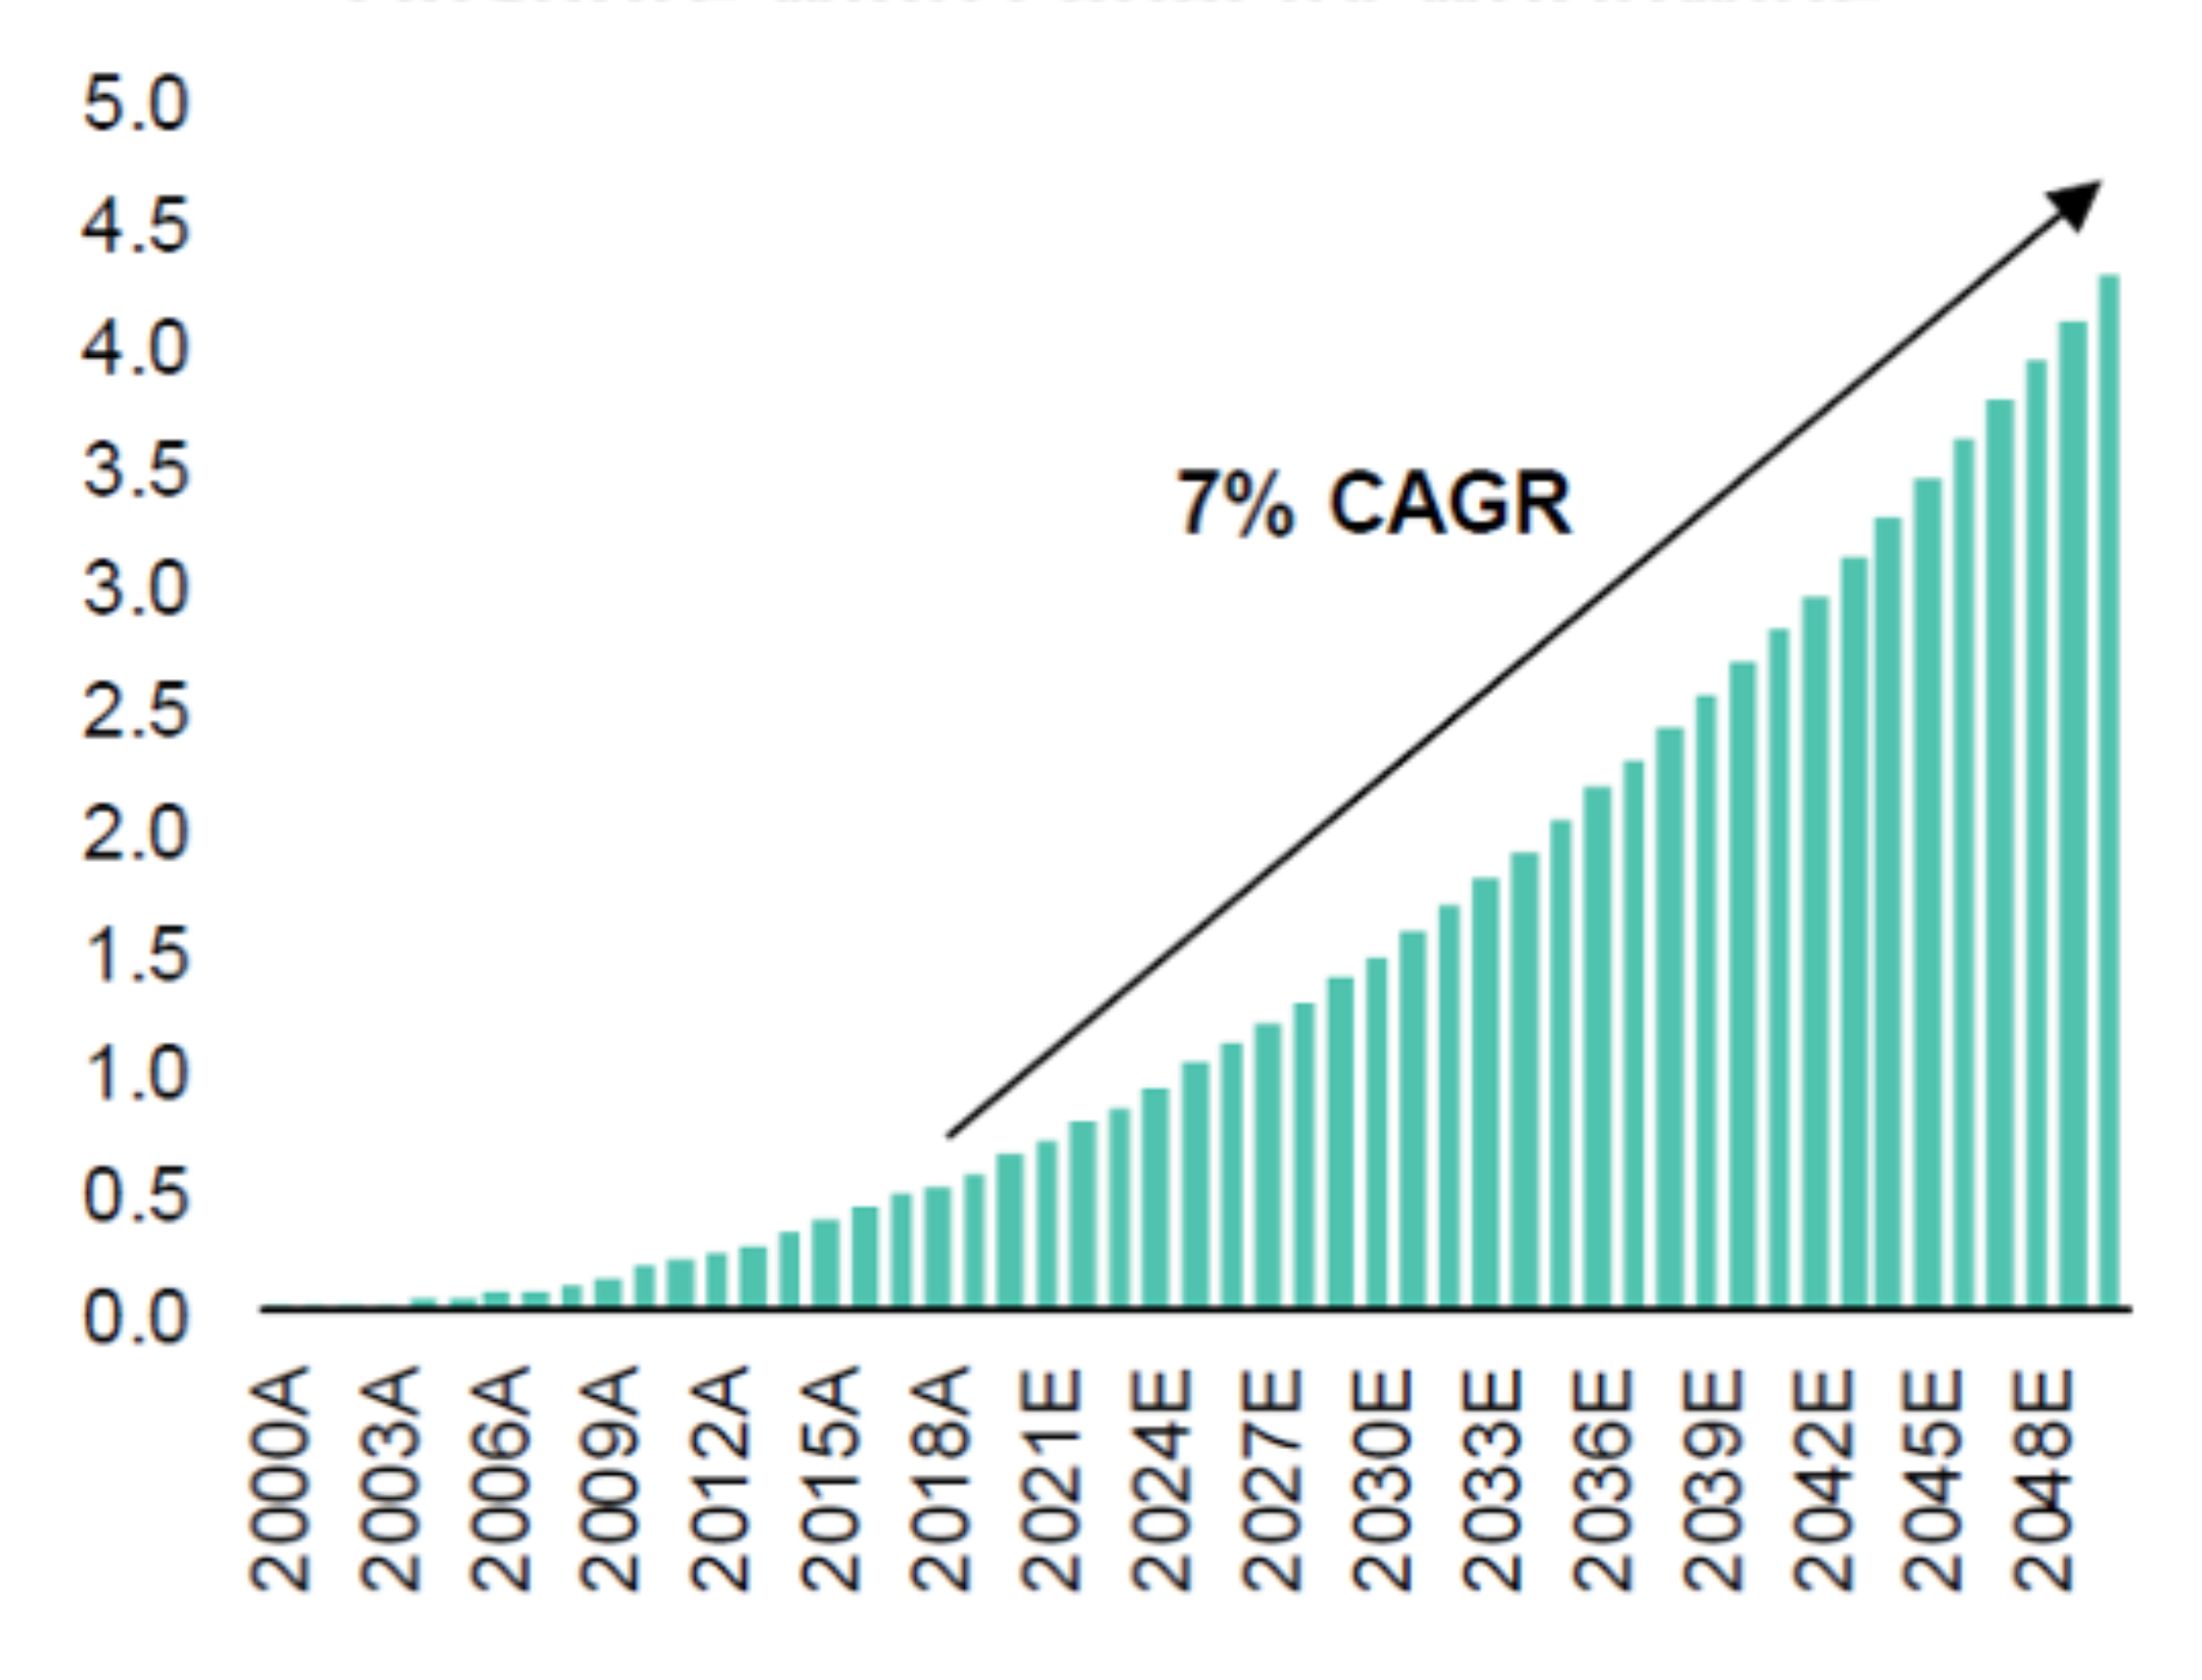
Source: Bernstein analysis and estimates
Offshore wind energy is a relatively nascent technology, which faces high capital costs, making it essential for producers to scale up projects to significant size, while having clear regulatory frameworks that offer suitable visibility to protect the value of these long-duration investments.
As such, offshore wind was barely a blip in the mix of renewable energy projects undertaken over the past five years. However, as the LCOE has come down and the regulatory framework has improved, we have seen an inflection point for offshore wind installations (Exhibit 7).
Exhibit 7: Growth of Offshore Wind Installations
Source: GWEC, Irena, EWEA, IEA and Bernstein estimates and analysis
The cost of offshore wind is coming down rapidly, and Bernstein estimates that 65% of future cost reductions will come from lower capex costs for turbines, with advances in technology not only reducing costs, but also improving performance. As a result, higher load factors also contribute 16% to the potential reduction of offshore wind LCOE (Exhibit 8).
Exhibit 8: Offshore Wind Cost Reduction Potential
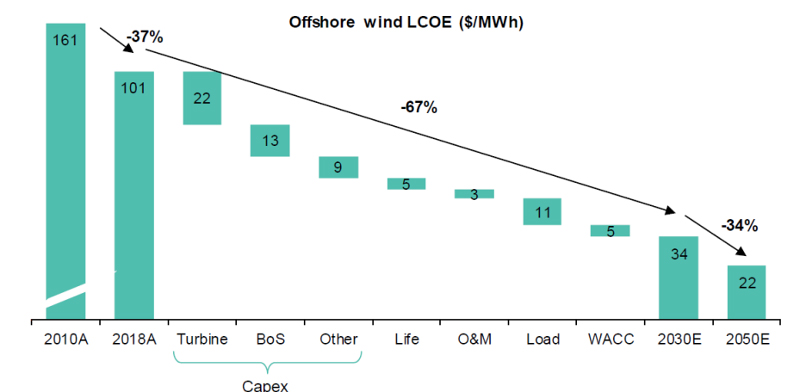
Source: Bernstein analysis and estimates
According to BloombergNEF, final investment decisions for 28 offshore wind projects representing $35 billion in investment were undertaken during the first half of 2020, four times the amount during the first half of 2019, and in fact a greater amount than were undertaken throughout the entirety of 2019.
As shown below, capital spending on offshore wind projects is set to eclipse that of offshore oil and gas in Europe (Exhibit 9), as international oil companies assess their plans for energy transition and carbon emissions reductions.
Exhibit 9: Offshore Wind Capex Set to Overtake Offshore Oil & Gas Capex in Europe
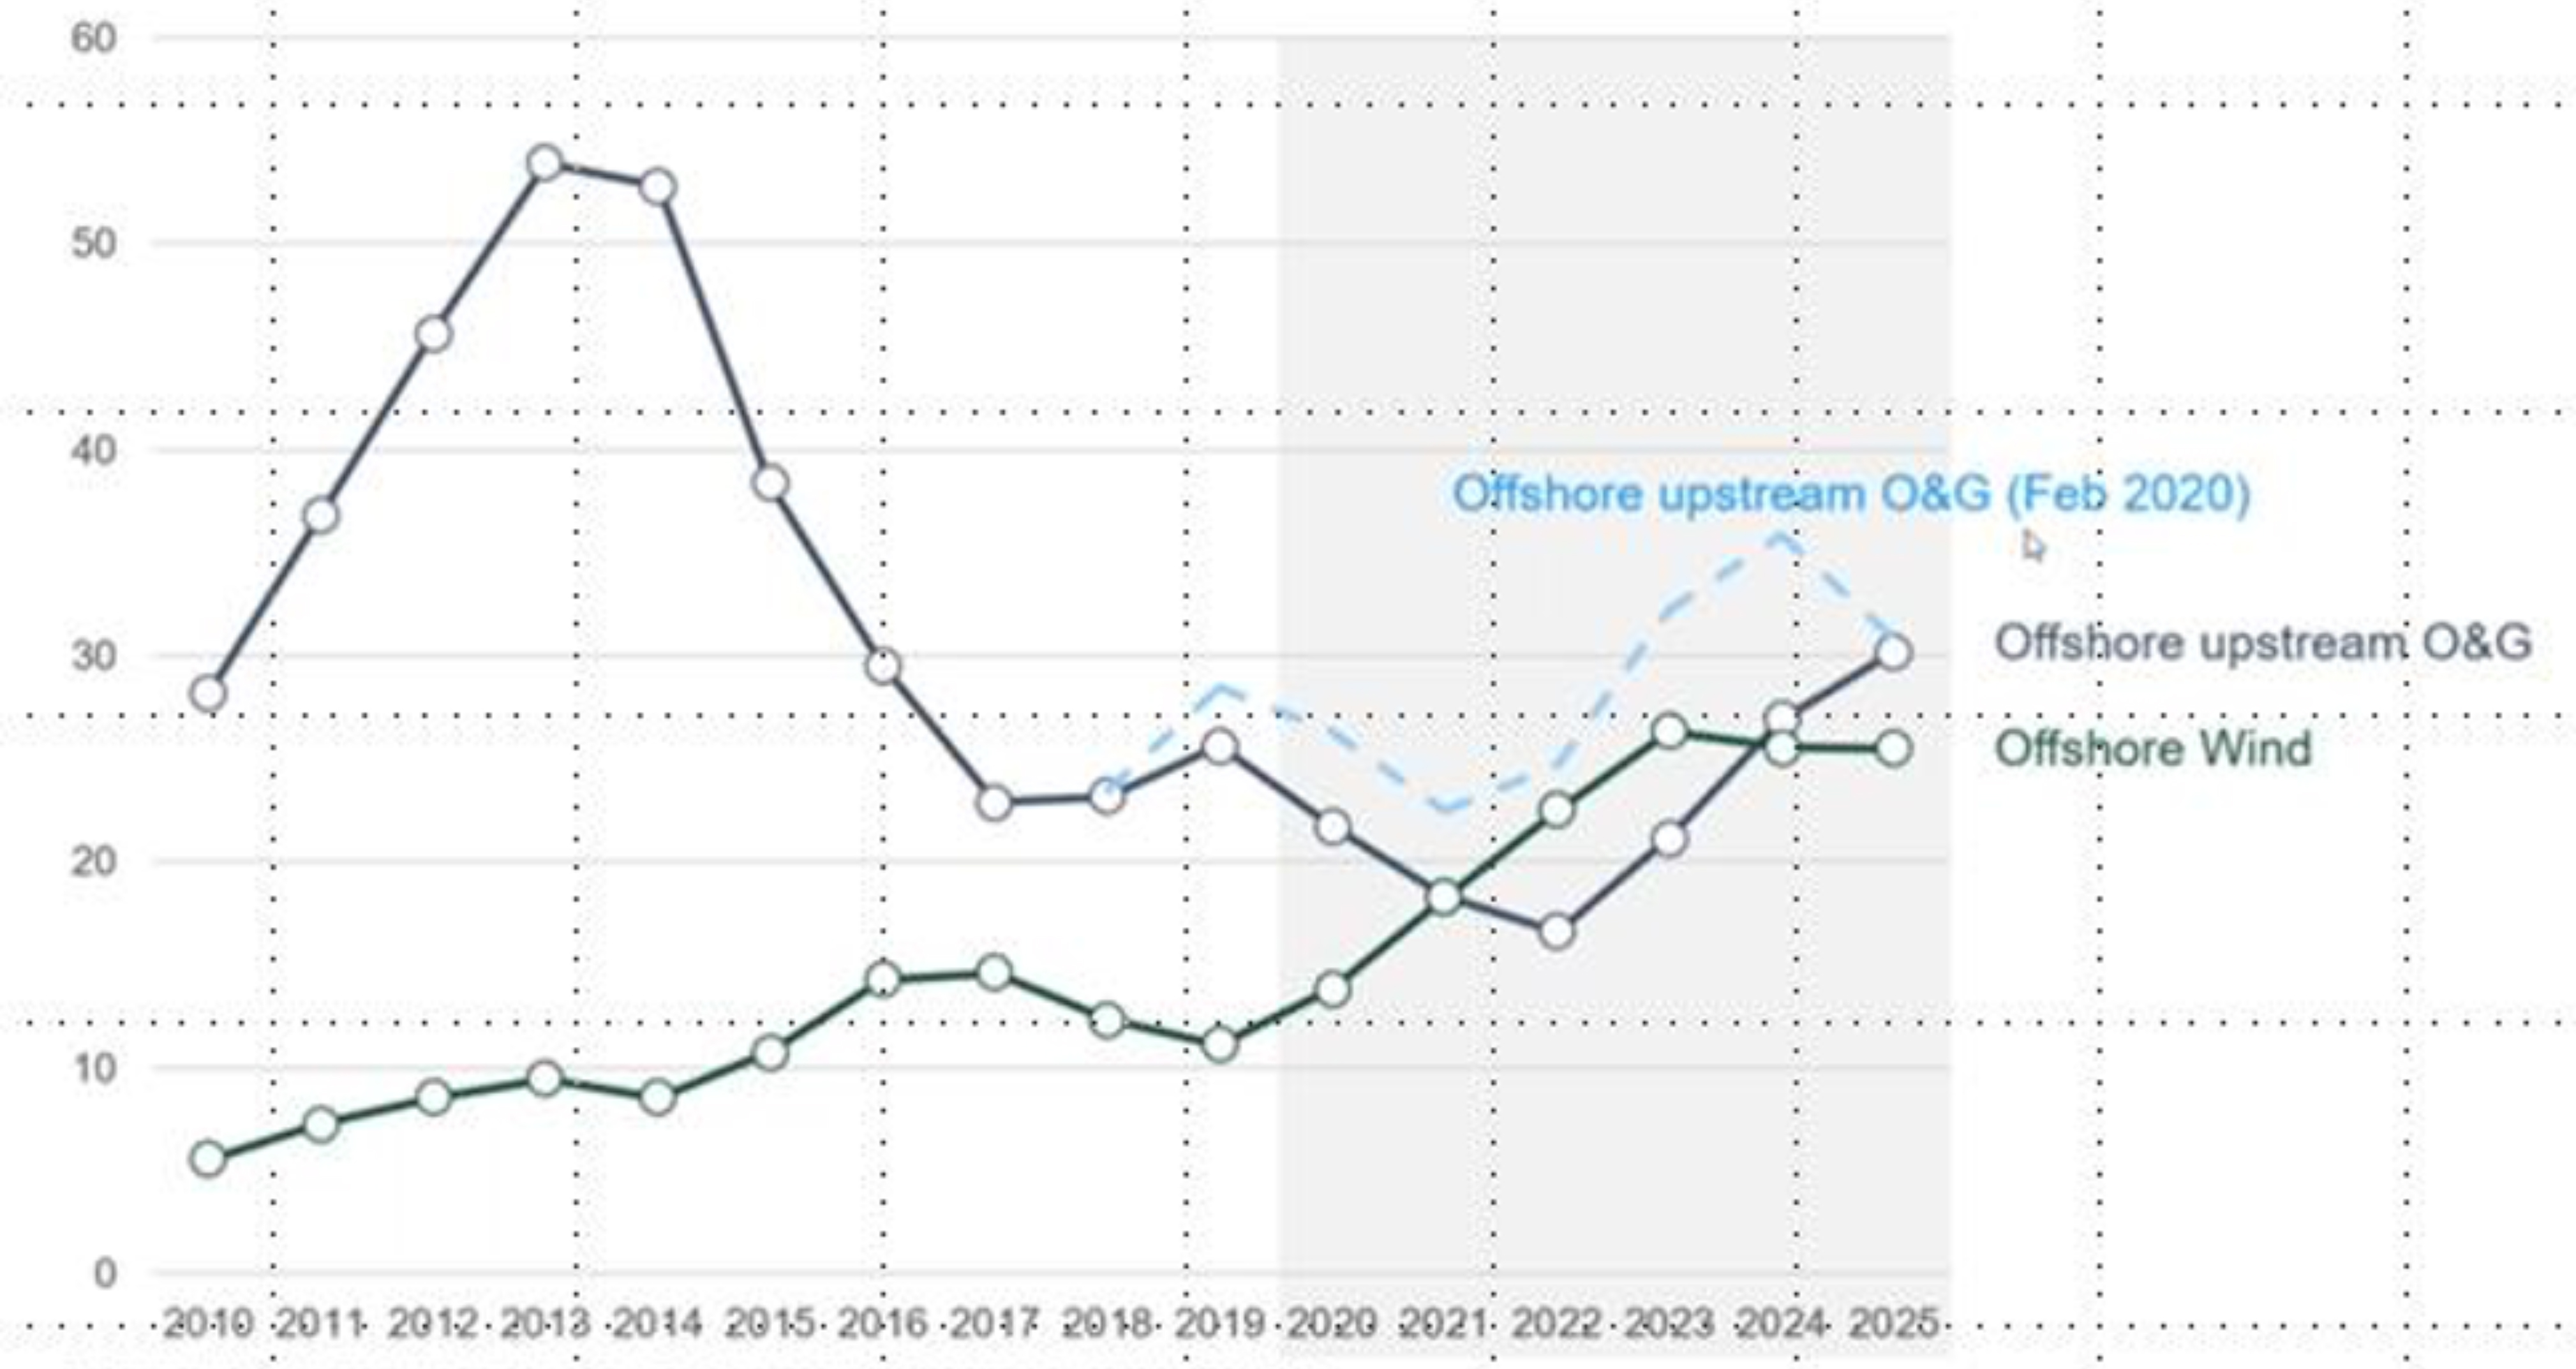
Expex excluded *Forecast takes into account capital expenditures for projects with start-up post 2025. Source: Rystad Energy research and analysis, UCube
While some leading players in this area are listed on European equity markets, there are also some interesting beneficiaries in emerging markets (Exhibit 10). Out of the 28 offshore wind projects reaching their final investment decision in the first half of 2020, 17 are in China. Total renewable spending in China during the first half of 2020 was up 40% year-over-year to $41 billion, outstripping that of Europe, at $36 billion.
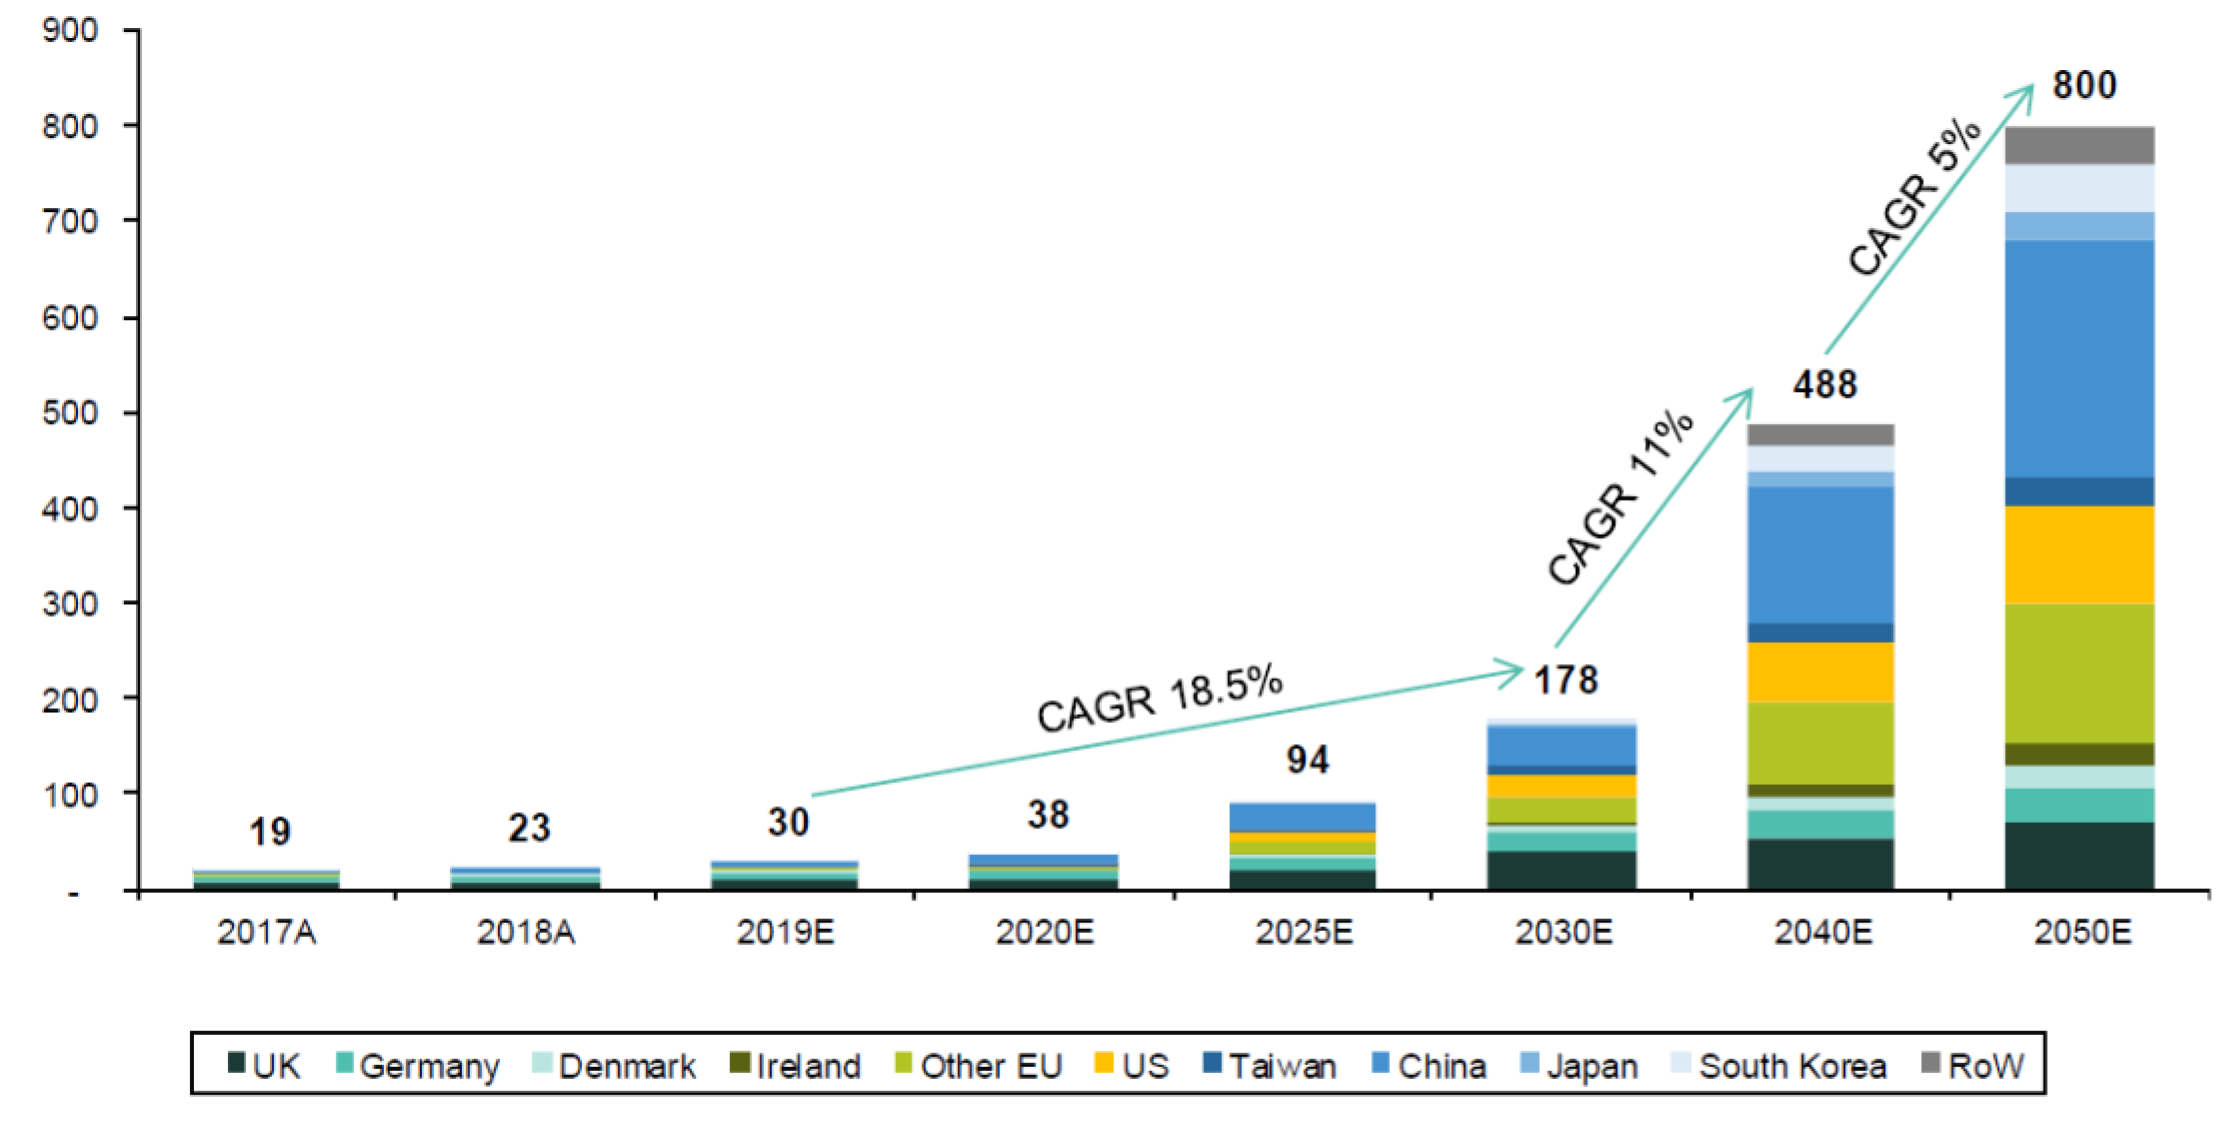
Exhibit 10: Offshore Wind Installed Capacity by Country
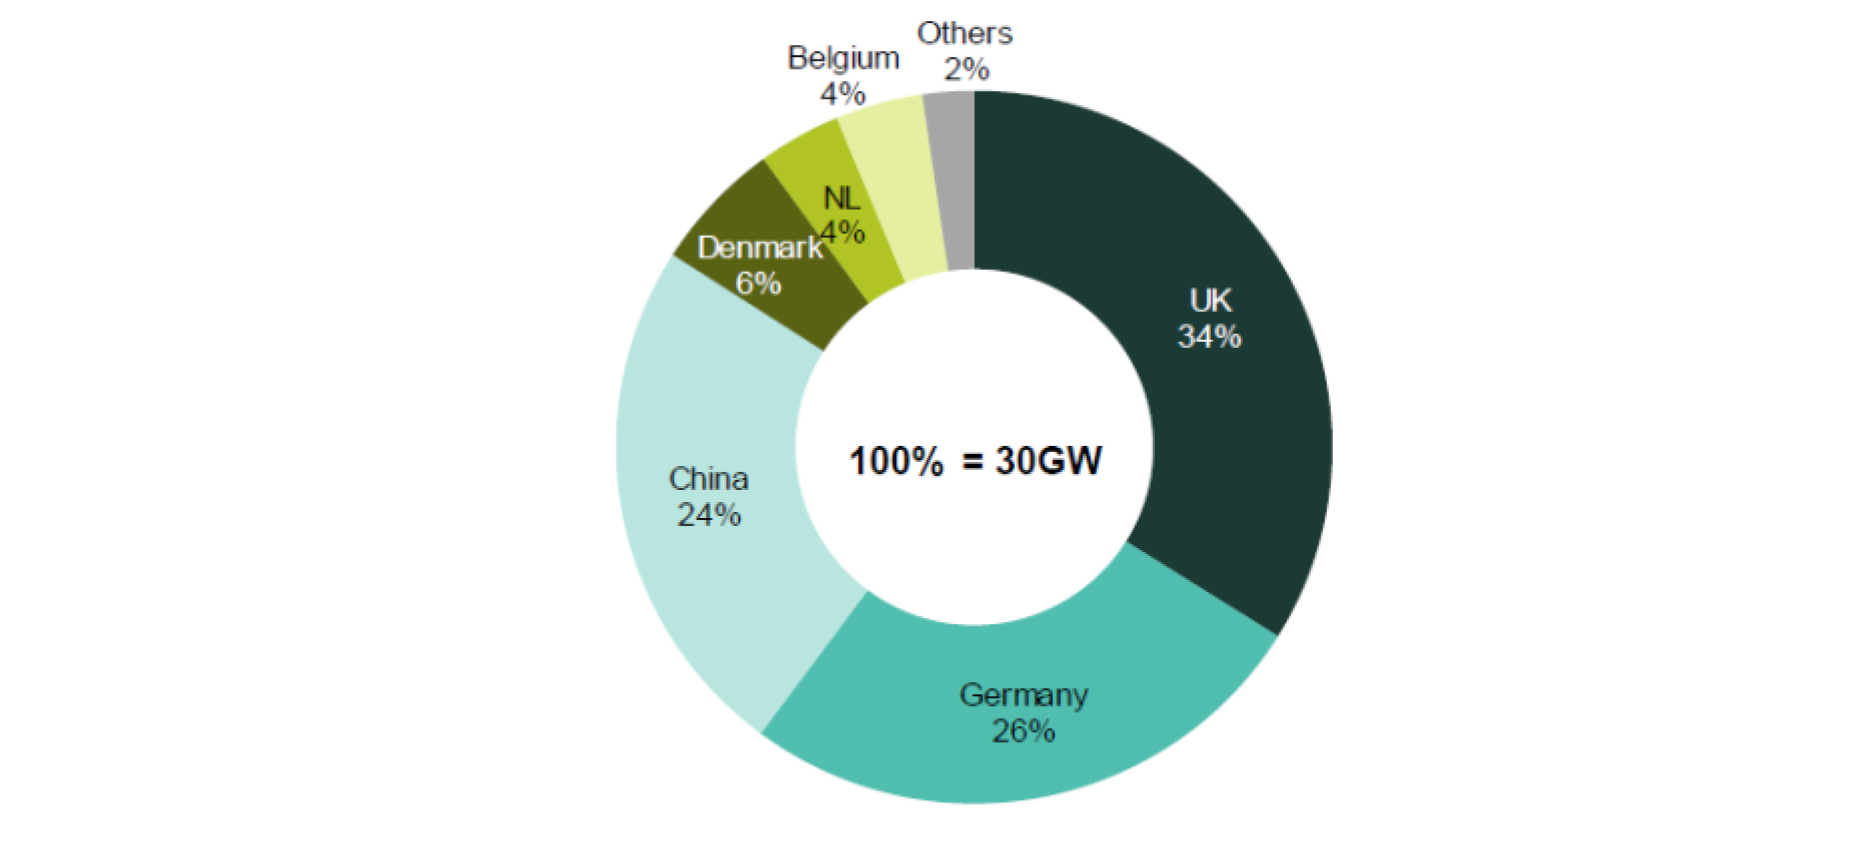
Source: GWEC, Irena, Bernstein analysis and estimates
Taiwan also has ambitious plans for offshore wind, positioning the country to be a major player in this area on a global basis. According to 4C Offshore, 16 of the world’s top 20 areas for wind speeds are located along the Taiwan Strait. Danish renewable power utility company Orsted recently signed the largest ever renewable energy deal with Taiwan Semiconductor Manufacturing Company, supplying the company with all of the power from Orsted’s proposed 920-megawatt offshore wind farm for 20 years. Considering Taiwan’s goals to generate 20% of its power from renewables by 2030 and to install over 15GW of offshore wind capacity by 2035, similar deals are likely to follow.
We like a position in a Taiwanese company that builds underwater foundations for offshore wind installations. This type of work must be conducted domestically, as the costs and logistical constraints associated with exporting these foundations are too cumbersome. The longer-term tailwind of new developments of offshore wind projects should provide a strong revenue growth driver for this highly profitable niche.
The acceleration of renewable energy installations has facilitated associated technologies to help decarbonize highly pollutive industries, leading to inflection points in hydrogen and electric vehicles (EVs).
Hydrogen and Electric Vehicles
Hydrogen is a technology that has been less economically viable in the past, but is now emerging as a means of reducing industrial emissions associated with steelmaking, trucking and heating.
One of the key advantages of hydrogen is that it can be stored for a long time. This enables long-range transportation and synergies with renewables. When burned, hydrogen emits no carbon dioxide, only water vapor. The drawback is that today the vast majority of hydrogen is produced from fossil fuels, with only 4% of hydrogen produced using renewables. So-called “green hydrogen” that is generated from renewable sources through electrolysis is almost twice as costly as “blue hydrogen” produced from fossil fuels, though the costs are coming down rapidly, particularly as the scale of renewable power generation grows.
Mobility will be one of the main sources of hydrogen demand, as fuel cell electric vehicles (FCEVs) have begun to gain traction in China and South Korea, due to their comparable range and refueling experience to conventional vehicles. Technological improvements have brought down the manufacturing cost considerably, though scale and infrastructure constraints have prevented FCEVs from reaching critical mass.
Trucking is the largest oil-consuming sector, comprising 25% of overall oil demand. Virtually the entire global truck fleet is powered by gasoline and diesel, as hydrogen-fueled trucks make up just 0.3% of the total fleet. FCEVs are becoming increasingly competitive in the trucking industry, with a fuel efficiency 2-3x that of regular diesel.
We like a position in a leading manufacturer of truck engines in China, which is moving into fuel cell engines, while also taking equity stakes in two international fuel cell producers. The company recently opened a plant in China with capacity to manufacture 20,000 hydrogen fuel cell stacks. China hopes to achieve a breakthrough in core fuel cell technologies within 4 years, and the government continues to encourage R&D in key fuel cell components.
Similarly, technological advances and favorable regulation have driven an inflection point for electric vehicles (EVs) (Exhibit 11). No longer simply a high-priced concept, EVs now provide good value for the consumer, with competitive price tags compared to internal combustion engines, and in some cases, generous subsidies. Auto manufacturers that don’t do their homework now are at risk of missing out on the trend, as a number of leading global players are rapidly scaling up their EV production.
Exhibit 11: EV Sales and Penetration Rates by Region
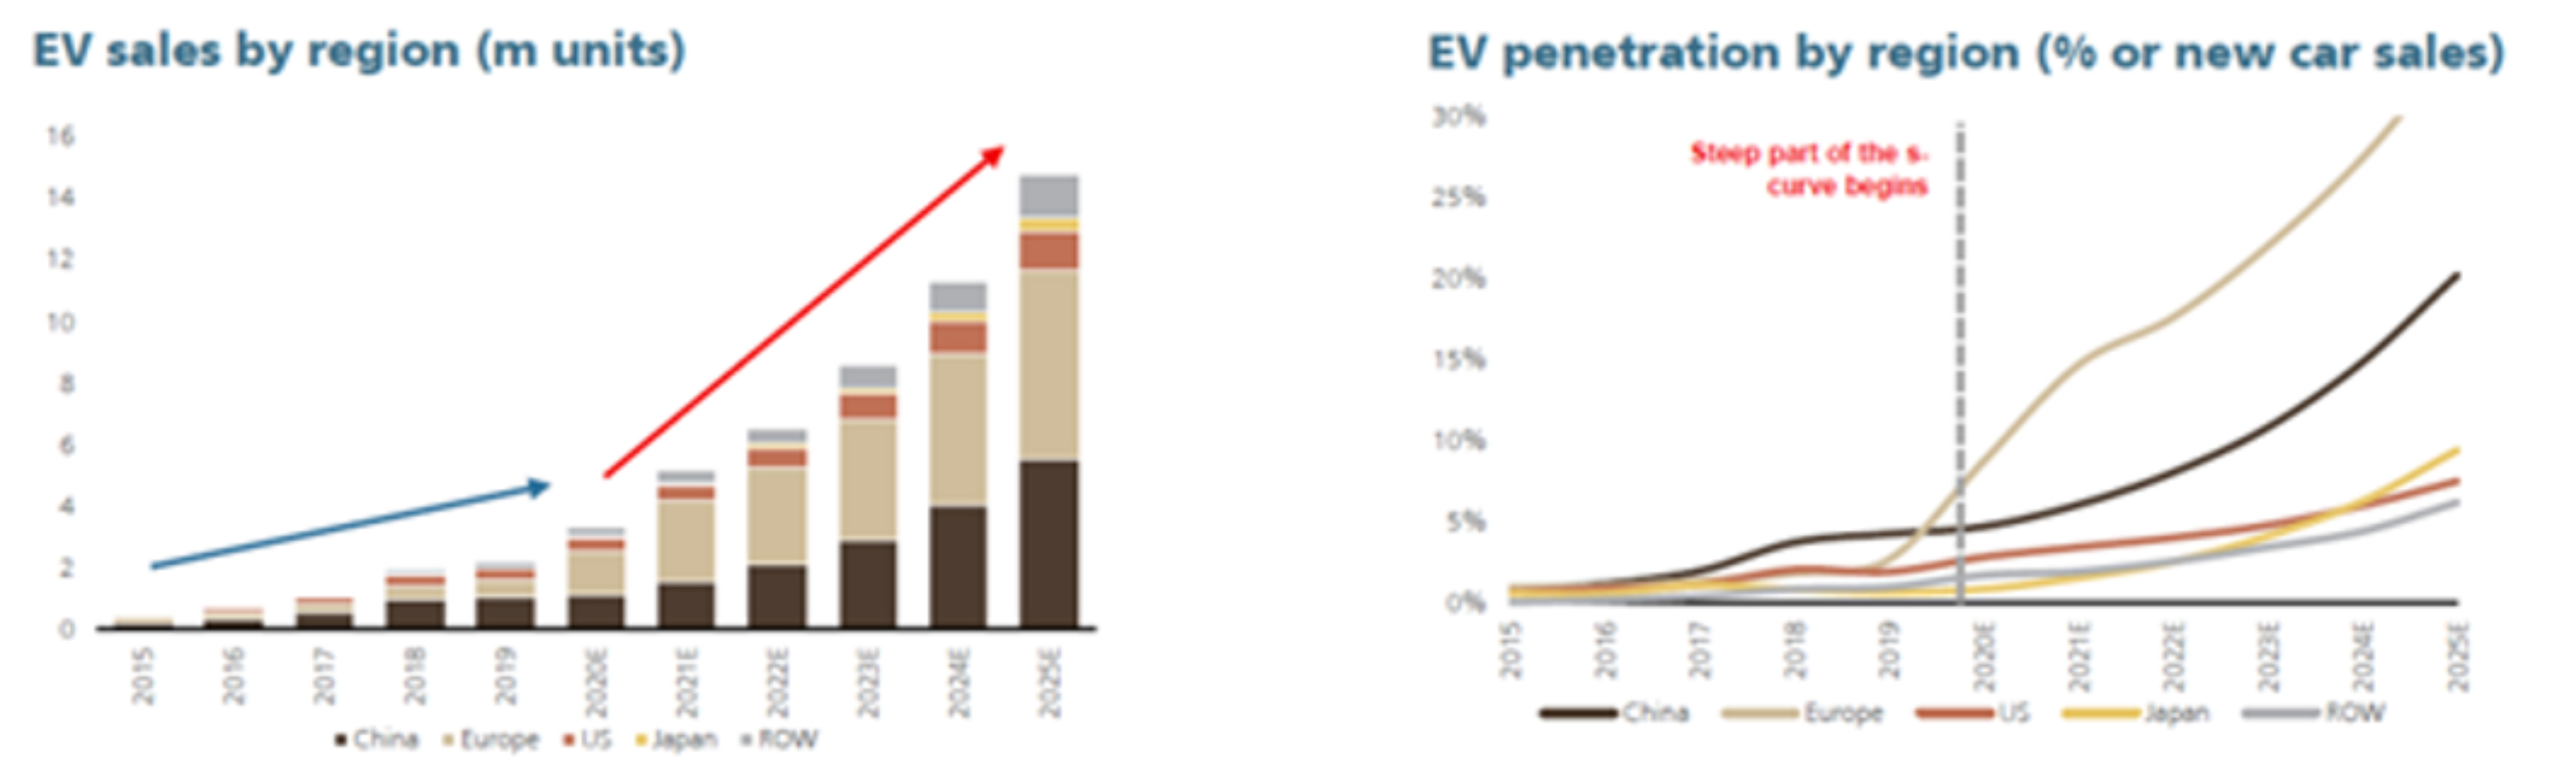
Source: UBS
Growing Investable Opportunities within Emerging Markets
In tandem with the acceleration in renewables, the Green Deal is changing the landscape for EVs in Europe, with aggressive subsidies leading the market to shift into a supply constrained situation. Europe already claimed the highest EV penetration in the world, and this bold policy looks poised to extend Europe’s leading position.
China implemented a 60% EV subsidy cut last year, which created a high base effect for growth in 2020, due to pre-buying before the subsidy reduction. Accordingly, EV volumes were under pressure during the first half of 2020, declining by approximately 40% year-over-year. However, the introduction of new models by leading players such as Tesla, along with an easier base effect, could lead to a marked improvement in growth in the second half of the year and in 2021. The Chinese government expects to reach 25% penetration by 2025, and improvements in battery technology continue to drive better affordability. However, in order to hit this target, vast increases in charging infrastructure will likely be required.
EV battery companies have been a strong source of performance for the strategy, as we currently hold positions in two of the top global battery makers. This is a highly concentrated market, with the top three players holding 80-90% market share. Gains from advances in battery chemistry have largely accrued to these leading players, who have been first movers in the market. Following aggressive increases in capacity, these companies are now benefiting from economies of scale and have been further supported by declines in the prices of battery materials such as lithium and cobalt, as new supplies of these commodities have come online in recent years.
In recent years, we have heard increasingly bold plans by corporate executives and policymakers to facilitate a transition in energy and power markets throughout the world. In the aftermath of COVID-19, investments in energy transition should help create new jobs in a rapidly growing industry, while putting the world on a path to a sustainable reduction in carbon intensity. According to Bernstein, by 2050 we could see combined global renewables capacity (including hydro) of close to 15TW, accounting for more than 70% of global power generation. While challenges remain, tangible advances in technology have dramatically improved the economics of solar, onshore and offshore wind, hydrogen, and electric vehicles, leveling the playing field with more conventional technologies, and creating a significant investable opportunity across emerging markets.
This information is not intended to provide investment advice. Nothing herein should be construed as a solicitation, recommendation or an offer to buy, sell or hold any securities, market sectors, other investments or to adopt any investment strategy or strategies. You should assess your own investment needs based on your individual financial circumstances and investment objectives. This material is not intended to be relied upon as a forecast or research. The opinions expressed are those of Driehaus Capital Management LLC (“Driehaus”) as of July 2020 and are subject to change at any time due to changes in market or economic conditions. The information has not been updated since July 2020 and may not reflect recent market activity. The information and opinions contained in this material are derived from proprietary and non-proprietary sources deemed by Driehaus to be reliable and are not necessarily all inclusive. Driehaus does not guarantee the accuracy or completeness of this information. There is no guarantee that any forecasts made will come to pass. Reliance upon information in this material is at the sole discretion of the reader.
Other Commentaries
Driehaus Emerging Markets Small Cap Equity Strategy March 2024 Commentary With Attribution
By Chad Cleaver, CFA
Driehaus Emerging Markets Growth Strategy March 2024 Commentary with Attribution
By Howie Schwab